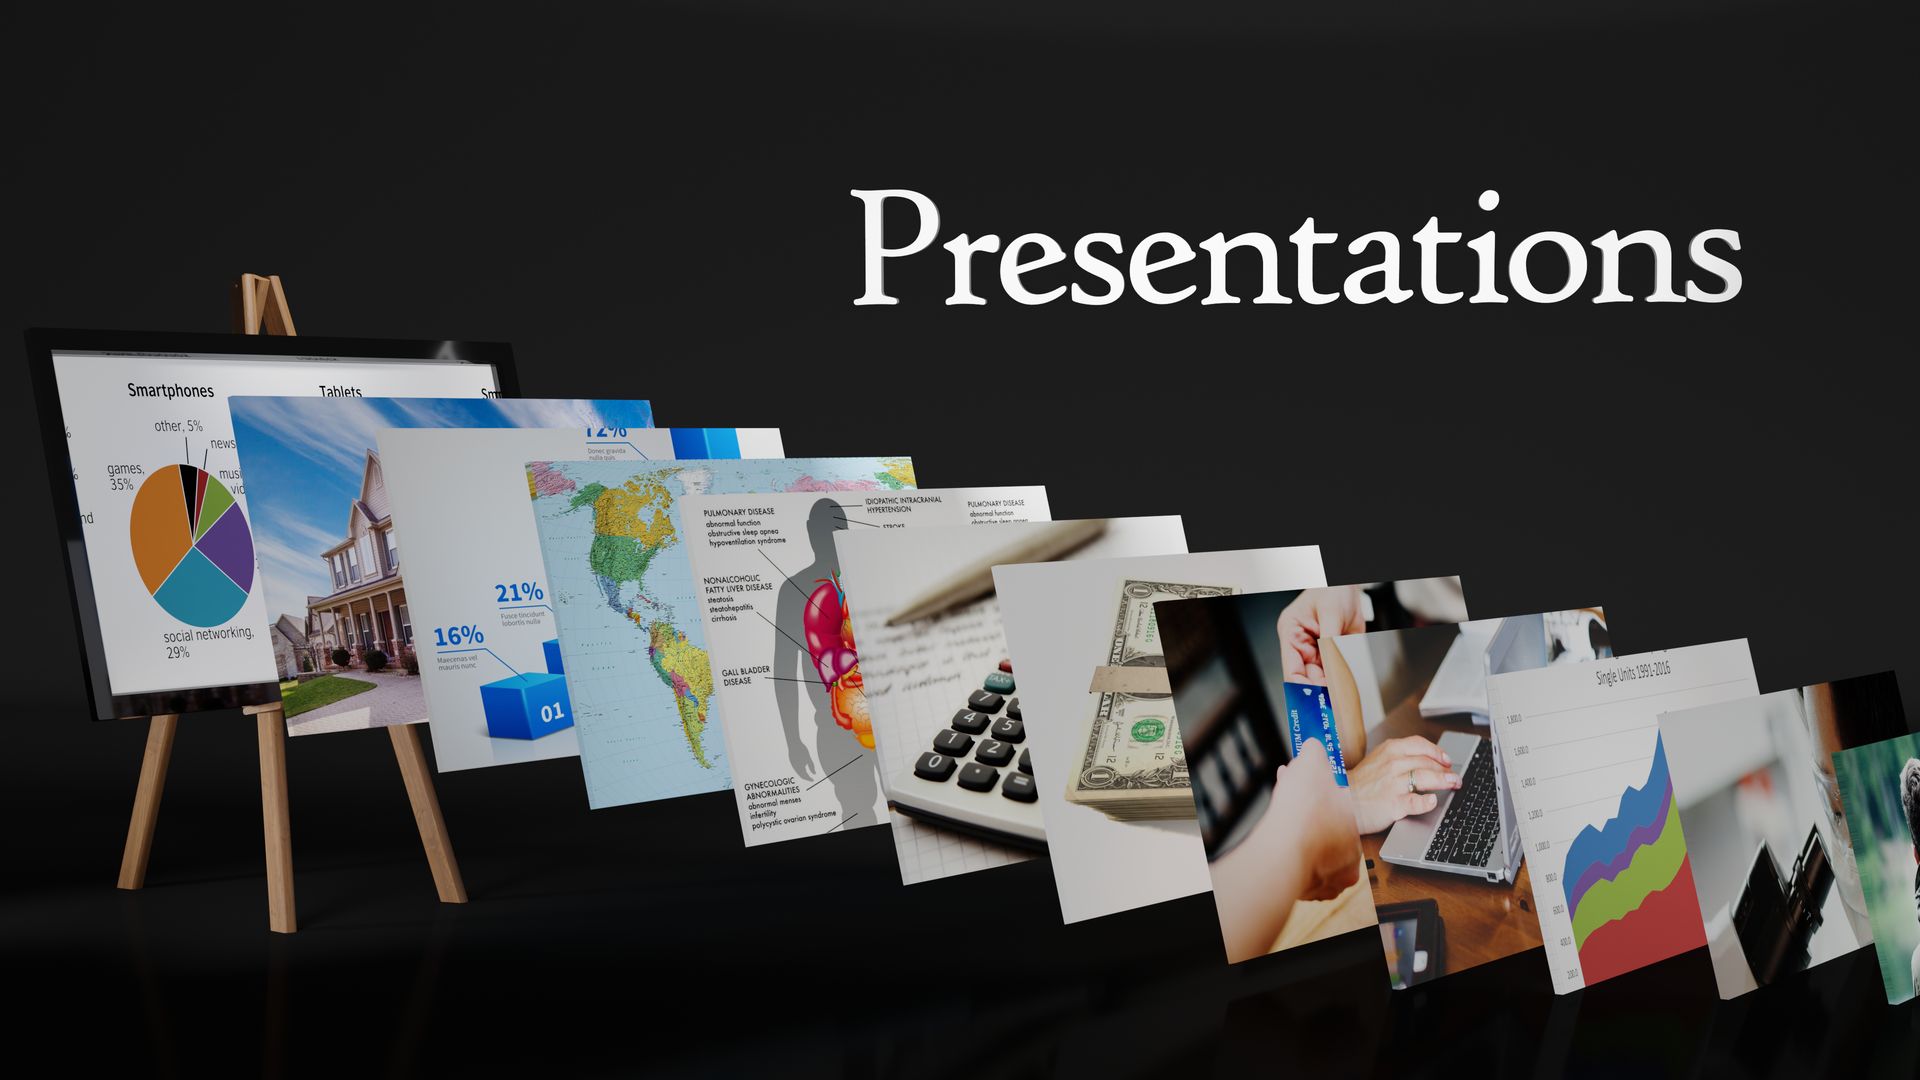
VISUALLY show your presentation
"Show Don't Tell!"
—Film and Graphics Industry
Why does the age old screenwriting mantra endure? Because a picture really can tell a thousand words.
We offer presentations of all sizes and formats. Slideshows, graphics, charts, diagrams, flow charts, Webinar and Zoom call slides, etc.
What is a Graphic Presentation?
Graphic presentation uses numerous forms of expression ranging from the written word to the most abstract of drawings or statistical graphs. The purpose is better understanding by visual Content. A Presentation provides an important medium of expression which helps clarify literally, verbally, or statistically any presented information.
People need to see it! And this brings improved understanding, improved retention, and improved response.
What goes into a Presentation?
Your imagination is the only thing that limits a presentation. We've created the full spectrum of presentations with exclusively words on a white background, and exclusively picturesque presentation containing NO words at all. Either way (and any variation in between) is better than standing in front of people trying to convey your intended message with nothing other than your verbal description.
Further, Presentations with truly nice graphics leaves the audience with a lasting impression and your more memorable message.
We can create presentations for any platform such as Zoom, Google Slides, etc, and presentation graphic elements that can be used just anywhere. You'll discover the transitions between Frames (slides) are far less important than the slides themselves. So who cares? We quite often forego the software, simply create beauteous slides and utilize a photo slide show (photo manager) program to flip thru this organized collection of slides to achieve the same (actually far better) resulting Presentation.
Words are important. Keywords and Key phrases should be prominent on the screen, and held up long enough to explain the concept, give examples, and ensure its audience understanding.
Graphic Elements are important. Emphasize concepts, separate ideas from other ideas. Show importances, show relationships. Visually COMMUNICATE your message with anything that depicts the intended idea.
Diagrams and Charts and Flows are important. Use a diagram to show the appearance, structure, or workings of something. It becomes a schematic representation. Ever try to describe a living room layout to the wife without a diagram? Diagrams show drawings or plans that outline and explains the parts, operation, etc., of something. The scheme.
Use a chart to provide statistical (quantitative) data and to present the relationships between variables. Use a vertical or horizontal or circular chart. A table of data, to contrast data, to suggest relationships of data (ie. Pie Charts, etc.), or perhaps to symbolize a concise summary for comparison, etc. Anything to visually explain data. Simple or complex, use types, colors, arrangements, and detail to further aid the presentation.
My team and I use charts a lot. We can mull over a give chart for hours.

